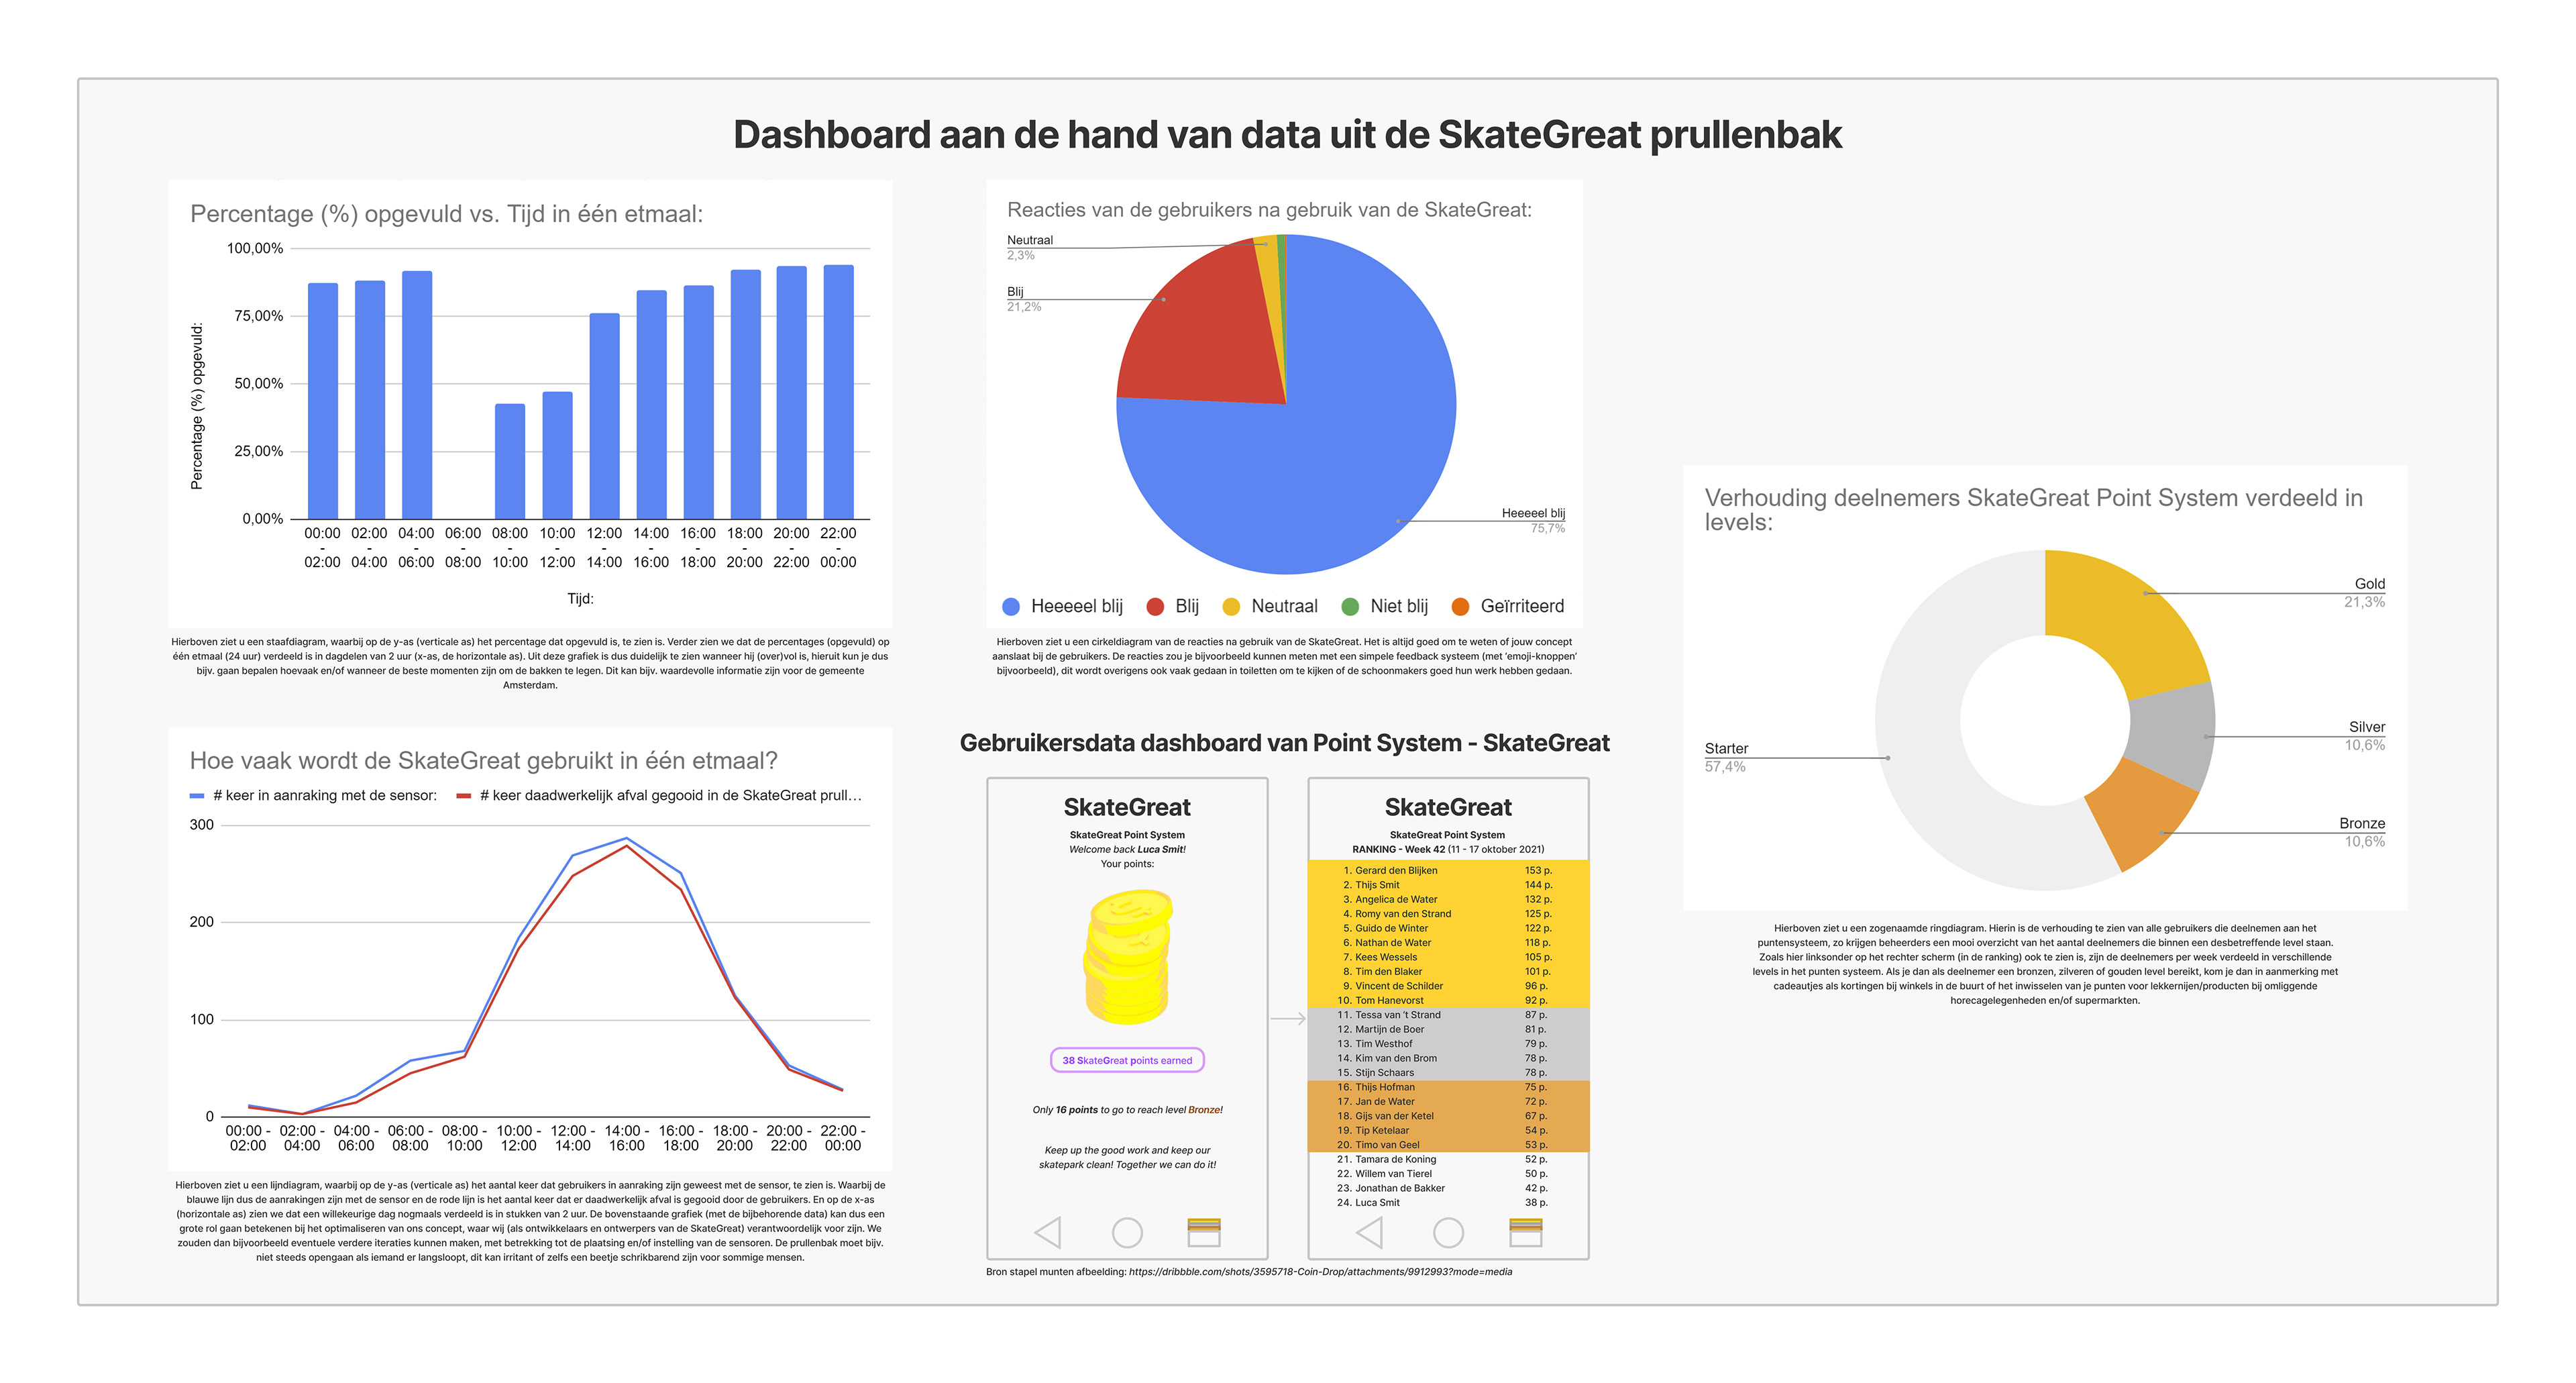
Above is a dashboard with data visualizations, created and designed by me. It was developed for the future administrators of this concept, to support content operations (the back-stage of the company). The concept for this project was an interactive trash bin aimed at reducing litter in the area around Skatepark Zeeburgereiland in Amsterdam. The data shown here was taken from a (fictional) database in the form of an Excel file, which records, among other things, user feedback, how full the bin becomes within a single day, and how often it is actually used. Finally, I also created and designed a reward points system for loyal users, including several screens to illustrate how this system could look. With these reward points, users could, for example, receive discounts for events and/or nearby catering establishments.